Logs Are Talking.
You're Not Listening.
Real-Time Log Viewer & Parser for Developers
Stop grepping through terminal output. Unify logs from any source, parse them automatically, and find what matters.
10,000 lines per minute.
Your console can't keep up.
That error you need?
It scrolled past 47 seconds ago.
Clear the console.
Lose the context.
Start over.
What if logs worked for you?
Every source. One view.
TCP, UDP, HTTP, file tailing, or browser console via our extension. Configure multiple sources per tab and see all your logs unified.
Supports: field=value, comparisons (>, <, >=), AND/OR, NOT, parentheses, wildcards (*)
level 4 2
status 3
service 3
Powerful Query Language.
Filter by any parsed field. Include or exclude values with a click. Chain conditions for precision filtering.
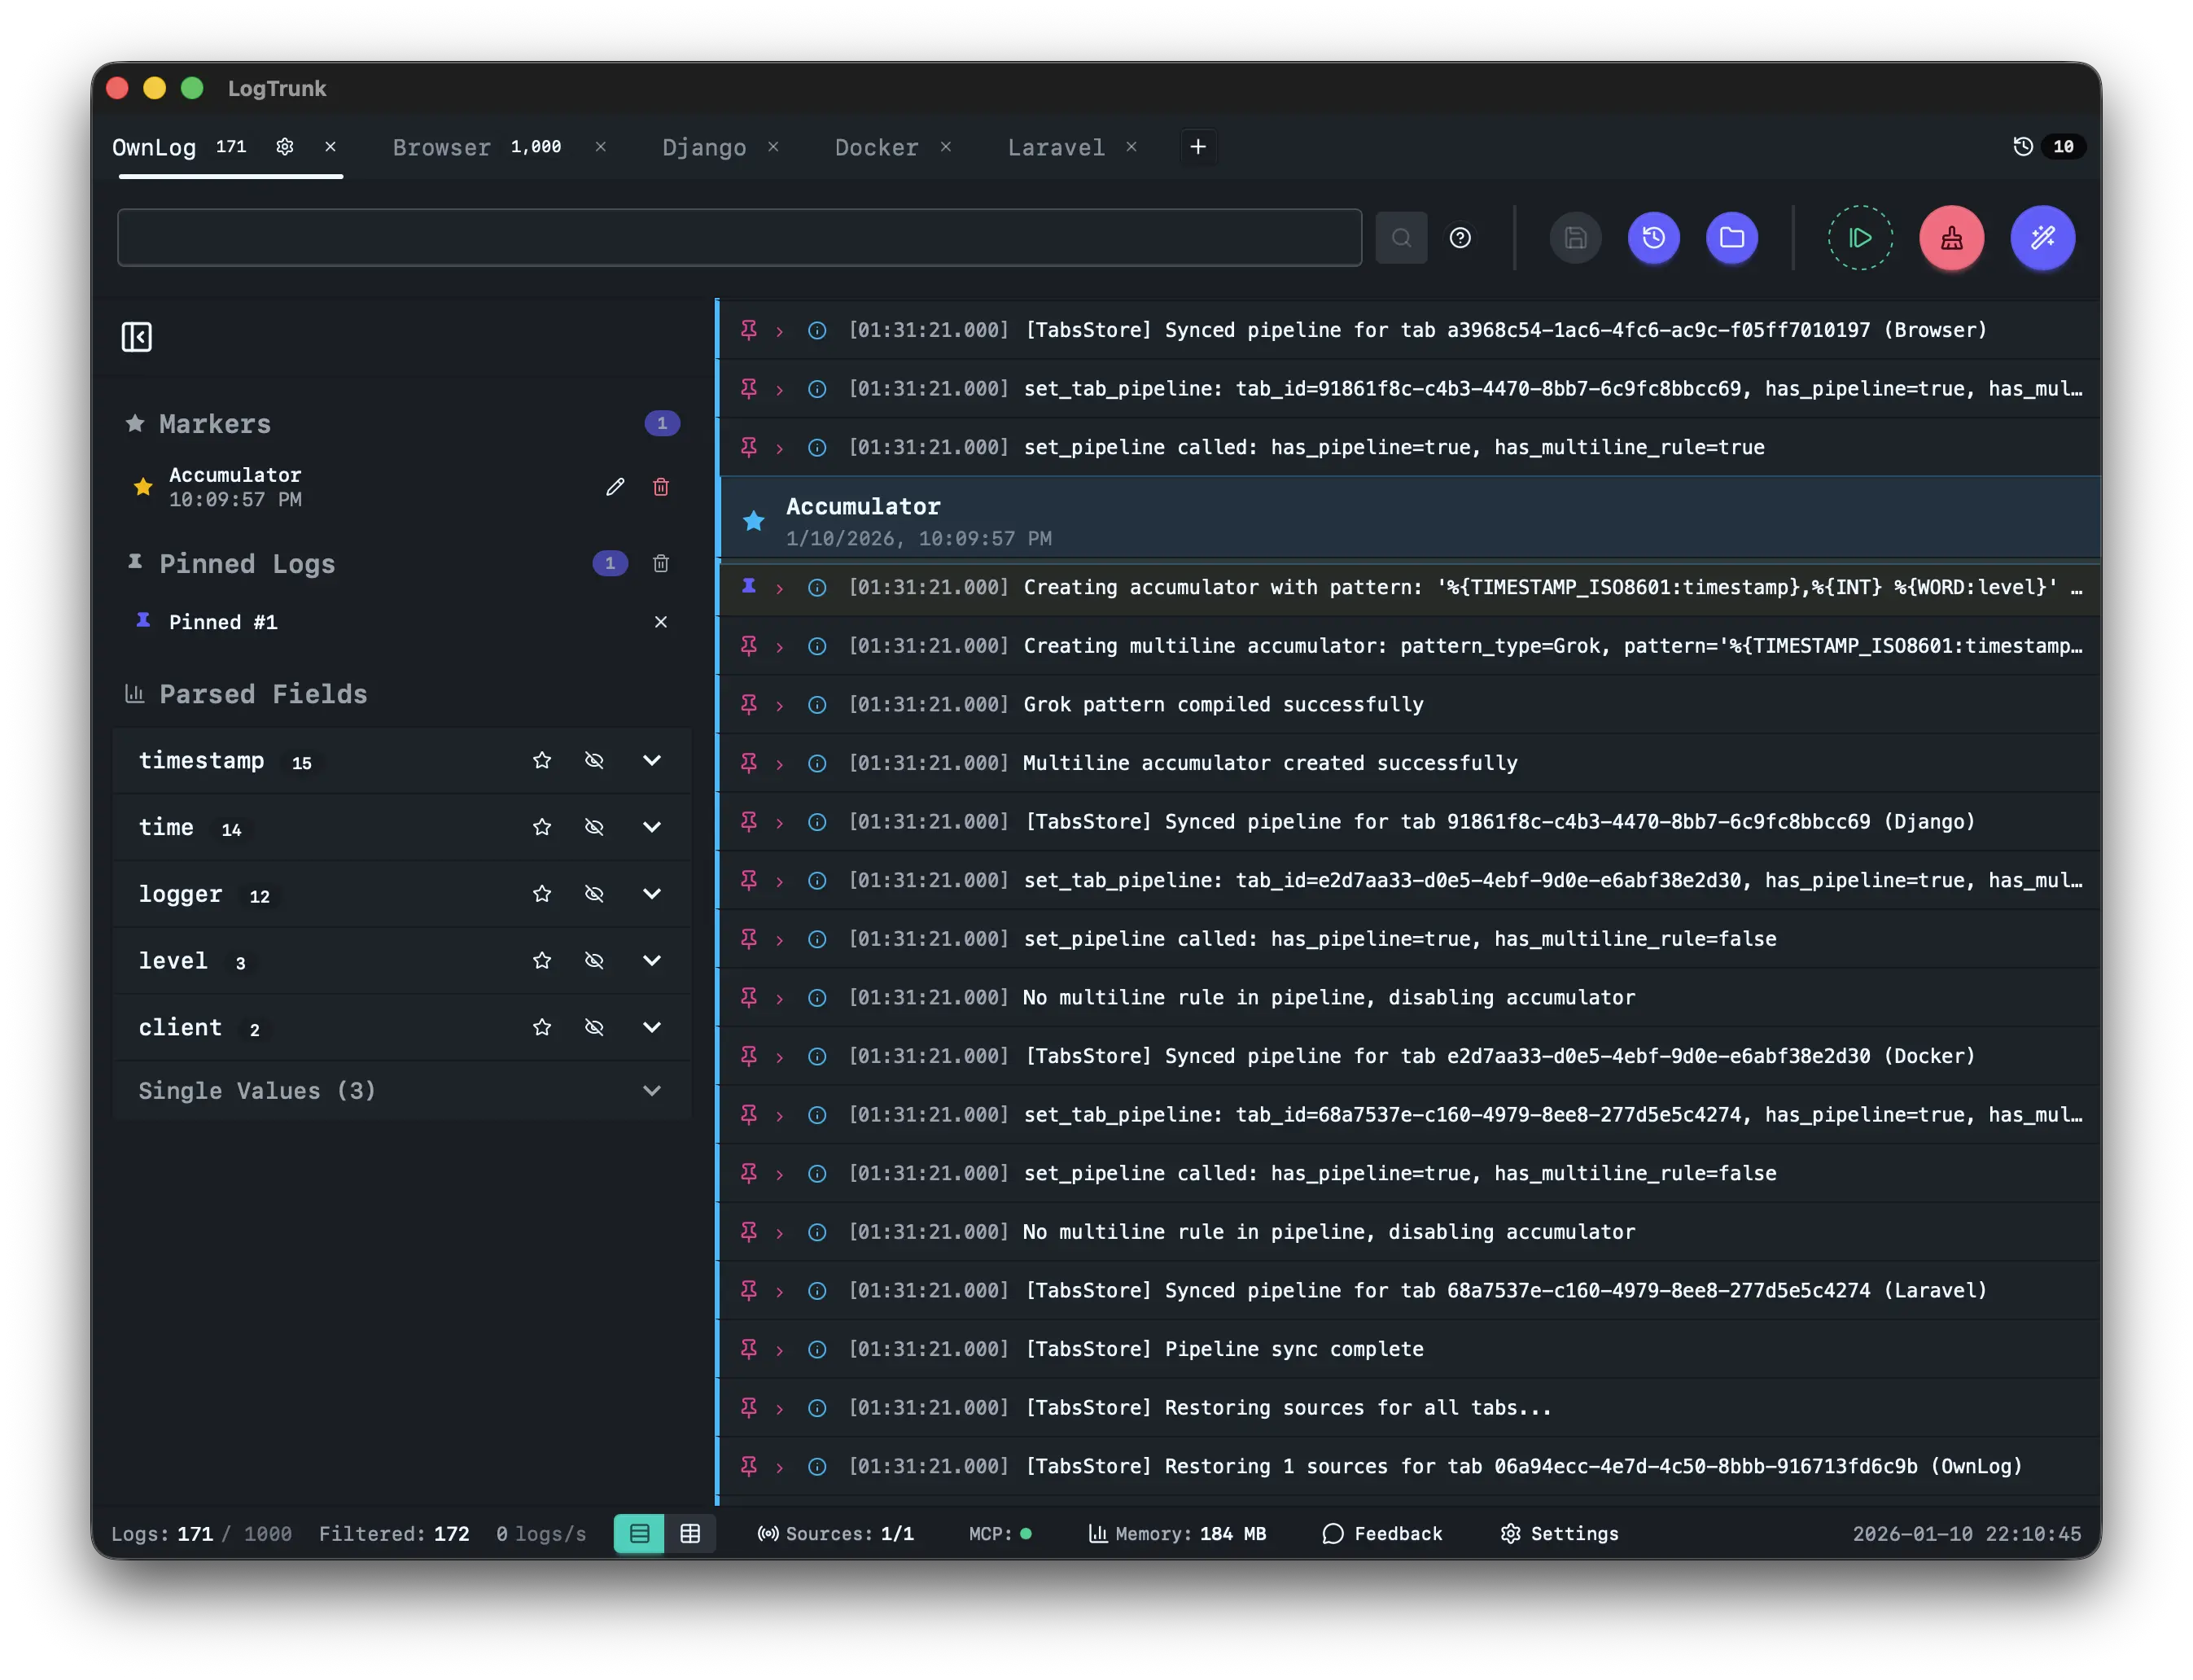
Pin it. Mark it. Keep it.
Pin important logs to preserve them. Add markers to separate debugging sessions. Never lose context again.
Parser Pipeline
- 1 Envelopestops
- 2 JSONstops
- 3 Grokstops
%{TIMESTAMP_ISO8601:ts} %{LOGLEVEL:level} %{GREEDYDATA:msg}
{"log":"2024-01-15T10:32:08Z INFO Starting...","stream":"stdout"}Zero-Config Parsing. JSON, Grok & Logfmt.
Auto-detect log formats or chain custom parsers in a pipeline. Let AI suggest the right pattern when you need it.
Debug with AI.
Connect via MCP protocol. Let AI query, analyze, and mark your logs. Turn debugging into a conversation.
get_logs query_logs add_marker get_markersExample Prompts
Appearance
Light Theme
Dark Theme
Make it yours.
Light, dark, or system. Choose from built-in themes or create your own with custom CSS.